The Sovereign Balance Sheet: Why Treasury Economists and Commentators Misunderstand Government Debt and the Operating Surplus
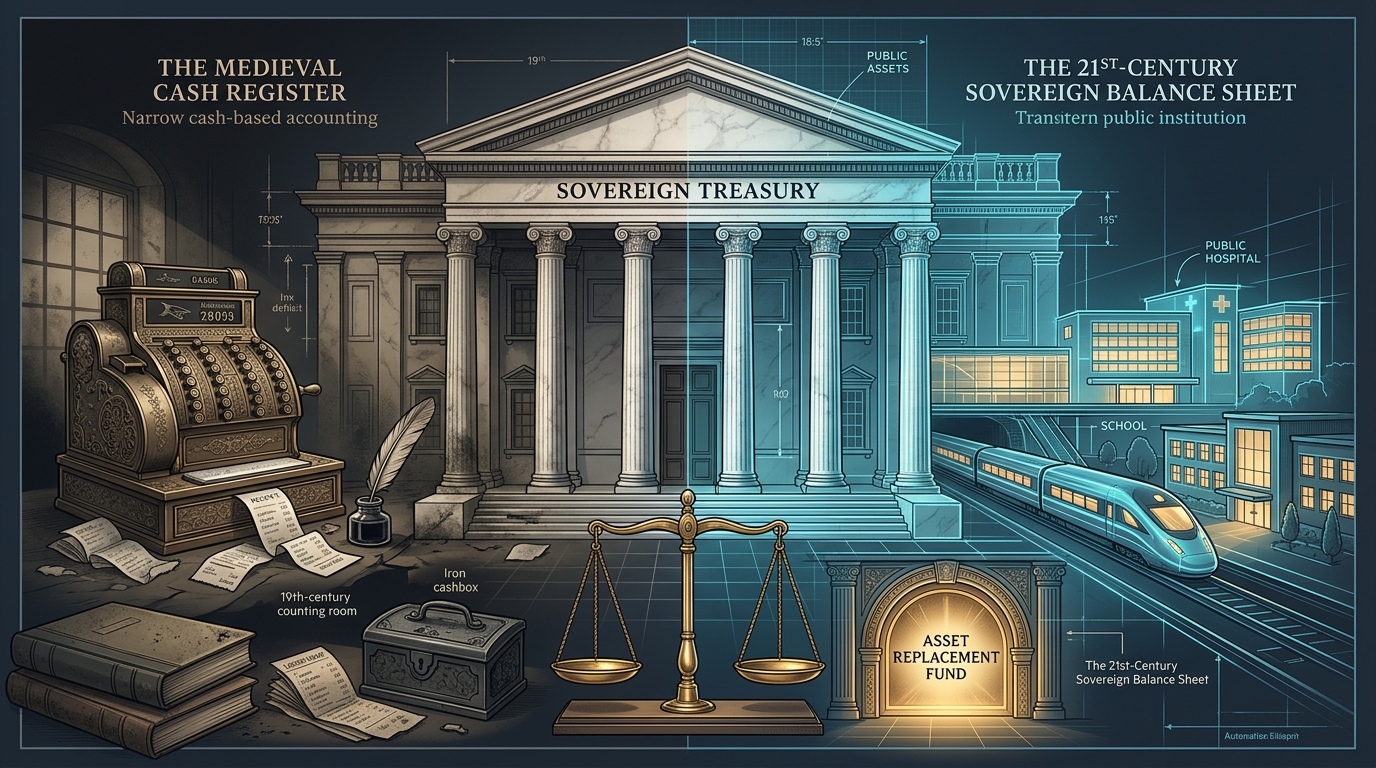
Replacing the medieval political cash register with 21st-century Whole-of-Government investment analysis, a Guardian-governed Intergenerational Equity Fund audited annually by the Auditor-General, and four binding Public Value Accounting Standards (PVS 1–4).
Ralph Booth — Public Sector Balance Sheet Pioneer
- Former Director of Government Financial Reporting (Victoria): Engineered and published Victoria’s inaugural Corporate-Style Whole-of-Government Financial Statements.
- Co-Founder (Team Effort), Victorian Managed Insurance Authority (VMIA): Used sovereign insurance to compel the creation of Victoria’s first comprehensive Whole-of-Government Physical Asset Register.
- Creator of the Debt Retirement Fund: Designed the ring-fenced statutory vehicle for the historic sale of the State Bank of Victoria.
- Treasury Debt Auditor: Tasked with recording all State liabilities—until instructed to stop looking for debt as it was time to publish Victoria’s Debt Information Paper No. 1.
Join the Live Public Value Debate on Substack
Read the companion essay “State Balance Sheet Management — Update the medieval cash register to the 21st Century” and add your commentary.
Executive Summary
Public debate surrounding government debt in Australia—particularly the intense political squabbling over state net debt approaching 24% to 25% of Gross State Product (GSP)—is fundamentally broken. Politicians weaponize headline debt numbers to incite fear; Treasurers defend deficits with partisan rhetoric; and media commentators analogize sovereign finances to household credit cards.
This widespread confusion exists because public discourse remains trapped in a primitive cash-accounting mindset. For decades, Treasury economists have failed to treat corporate-style Whole-of-Government Financial Statements as a dynamic investment tool.
This paper establishes the Sovereign Balance Sheet Doctrine across four core principles and translates them into four binding Public Value Accounting & Fiscal Reporting Standards (PVS 1–4):
- The Operating Surplus Objective Function (PVS 1): An operating surplus is not a political trophy; mathematically, its true purpose is to fund the proportion of capital expenditure not financed through prudent borrowings, plus scheduled consumption debt amortization.
- Depreciation as an Annual Audited Charge & The Intergenerational Equity Fund (PVS 2): Depreciation represents real physical capital consumed each year. Rather than burying intergenerational equity inside a 500-page report published once every five years, its cash equivalent must be quarantined annually into a statutory Intergenerational Equity Fund overseen by Guardians appointed by Government—standing as an annual charge on the Operating Statement and Balance Sheet audited every year by the Auditor-General so the public has full confidence there is no creative accounting.
- The Consumption Debt Amortization Horizon (PVS 3): Borrowing for current consumption (e.g., pandemic subsidies) creates zero depreciable assets on the balance sheet. Such debt requires an explicit repayment horizon (N years) added directly into annual operating surplus targets.
- Overpriced Public Assets & The Commissioning Write-Down (PVS 4): When mega-projects suffer massive cost blowouts, governments capitalize the inflated expenditure as an overpriced balance-sheet asset and resort to predatory “value capture” taxes that choke public and private housing supply. Overpriced assets must be written down to true economic value at commissioning and reclassified as consumption debt.
1. The Origin: Debt Information Paper No. 1, the Debt Retirement Fund, and the VMIA
My perspective is not born from academic textbooks. It was forged in the engine room of Victorian public finance during some of the most volatile fiscal periods in the state’s history.
My earliest major trial in the Victorian Treasury was as a young accountant tasked with recording all the debt of the State. As I audited the true liabilities—uncovering off-balance-sheet arrangements, hidden guarantees, and unbooked exposures—I dug so deep and unearthed such uncomfortable numbers that I was told to stop looking for debt as it was time to publish Victoria's Debt Information Paper No. 1.
During that era of severe fiscal crisis and institutional restructuring, I worked on the team that created the Debt Retirement Fund—designed specifically to capture and ring-fence capital proceeds from major policy transactions, including the historic sale of the State Bank of Victoria, ensuring asset sale proceeds were dedicated directly to retiring structural liabilities rather than being swallowed by recurrent spending.
Yet debt is only half of any balance sheet. At the time, the State of Victoria possessed no comprehensive single source of truth for its physical wealth. To solve this, as part of an exceptional team effort, I was one of the founders of the Victorian Managed Insurance Authority (VMIA). While its public mandate was risk management and self-insurance, the VMIA served a vital strategic secondary purpose: it forced every government department, agency, and statutory authority to declare, inspect, value, and register their physical assets to qualify for sovereign insurance coverage. We turned insurance into a Trojan horse for truth.
Armed with that comprehensive asset register on one side and an audited debt schedule on the other, I went on as Director of Government Financial Reporting to engineer and publish the inaugural Corporate-Style Whole-of-Government Financial Statements for Victoria. Yet when my tenure concluded, Treasury economists failed to embrace them as a tool for economic statecraft—remaining illiterate from an investment analyst’s perspective.
2. The Four Core Laws of the Sovereign Balance Sheet
The Operating Surplus Objective Function
Governments never define why they target a particular operating surplus figure. In sovereign balance-sheet physics, the operating surplus has an exact mathematical objective:
where CapEx_Equity = Total Capital Expenditure − Prudent Asset-Backed Borrowings
If a state plans a $2.0B infrastructure program and prudently funds 60% ($1.2B) via long-term borrowings matched to asset life, the remaining 40% ($800M) must be generated from the operating surplus. The surplus is the community’s equity contribution to building public wealth.
Depreciation as an Annual Charge & The Intergenerational Equity Fund
When children attend schools, patients use hospitals, and freight trains cross bridges, those public assets wear down. Depreciation ($6.10B in Victoria in 2025–26) is the objective measure of physical capital consumed by citizens in that fiscal year.
Politicians prefer to bury “intergenerational equity” inside a 500-page Intergenerational Report published once every five years, evading year-to-year accountability. Under the Sovereign Balance Sheet Doctrine, the cash equivalent of annual depreciation must be transferred every year into a statutory Intergenerational Equity Fund overseen by independent Guardians appointed by Government.
Audited Annually by the Auditor-General: Political parties may resist this precisely because it places intergenerational equity on the Operating Statement and Balance Sheet every single year—requiring annual sign-off by the independent Auditor-General and giving the public ironclad confidence that there is no creative accounting.
Consumption Debt Must Carry an Explicit Amortization Horizon (N)
During crises such as COVID-19, governments borrowed billions for emergency wage subsidies and recurrent relief. No depreciable asset was created. Dumping consumption debt into general borrowing pools without an exit strategy is fiscal malpractice.
Parliament must declare an explicit N-year amortization horizon and add that annual tranche directly to the Target Operating Surplus until the consumption debt is extinguished.
Overpriced Public Assets, Value Capture Distortion & The Commissioning Write-Down
When mega-infrastructure projects suffer massive cost blowouts, governments capitalize 100% of the incurred cash expenditure onto the balance sheet (Asset_Book ≫ True Economic Value). To service this bloated capital liability, Treasuries impose aggressive “value capture” levies (windfall gains taxes, infrastructure charges, punitive land taxes) that collapse private residential development margins and inflate social housing costs.
The Commercial Solution: Upon project commissioning, assess the asset at its true independent economic value, write down the cost blowout immediately, and reclassify the impaired blowout as Unbacked Consumption Debt to be retired over N years—freeing housing supply from predatory value capture.
3. Empirical Case Study: Victoria’s 2025–26 Financial Report
Applying the Sovereign Balance Sheet Doctrine to the Victorian Government 2025–26 Financial Report exposes both the absurdity of “state bankruptcy” scaremongering and the urgent need for formal balance-sheet rules:
| Fiscal / Balance Sheet Aggregate | 2025–26 Actual | Sovereign Balance Sheet Analysis |
|---|---|---|
| Net Debt to GSP (GGS) | 24.0% ($160.7B) | Below the 24.7% revised estimate and backed by massive long-life physical infrastructure (unlike US Federal debt >100% of GDP funding recurrent consumption). |
| Non-Financial Physical Assets | $289.1B GGS ($552.5B State) | Tangible schools, hospitals, rail corridors, and water infrastructure generating multi-decade economic capacity. |
| State Net Worth (Equity) | +$197.3B GGS (+$317.0B State) | Vastly asset-positive—debunking simplistic “household credit card bankruptcy” rhetoric. |
| Net Operating Surplus | $2.39B ($9.82B Cash Surplus) | First operating surplus since 2018–19, yet reported without a formulaic link to CapEx equity requirements. |
| Annual Depreciation Expense | $6.10B | $6.10B of physical capital was consumed by citizens in 2025–26. Without a Guardian-governed Intergenerational Equity Fund audited annually by the Auditor-General, renewal is pushed onto future borrowings. |
| Property & Value Capture Taxes | $10.8B Stamp Duty + $2.3B Levies | Over-reliance on property and development levies to service un-impaired mega-project blowouts directly suppresses Victorian housing construction. |
3.1 The Booth Formula Stress Test: Why Victoria’s $2.39B Surplus Is Still $6.47B Short
When the Victorian Government released the 2025–26 Financial Report in October 2026, the Treasurer celebrated a $2.39B Net Operating Surplus—the state’s first operating surplus since before the pandemic—while the Opposition continued to warn of “state bankruptcy” at 24.0% Net Debt to GSP ($160.7B).
Applying the Sovereign Balance Sheet Doctrine (PVS 1–4) to the audited 2025–26 figures proves that both partisan narratives are wrong. Out of $20.50B in 2025–26 General Government infrastructure delivery, $6.10B represents physical asset consumption (annual depreciation under PVS 2), leaving $14.40B in net new capital expansion:
Actual 2025–26 Operating Surplus = $2.39B → Annual Structural Surplus Shortfall = −$6.47B
| Stress-Test Component | 2025–26 Treasury Headline | Booth Doctrine Target (PVS 1–4) | Annual Fiscal Gap |
|---|---|---|---|
| 1. CapEx Equity Share (PVS 1) 40% equity / 60% debt on $14.40B net new CapEx ($20.50B gross less $6.10B renewal) |
Unanchored in Budget | $5.76B ($8.20B on gross CapEx) | Unfunded via Surplus |
| 2. COVID Consumption Debt Paydown (PVS 3) $31.50B pandemic consumption debt amortized over N = 15 years |
Commingled in Net Debt | $2.10B / yr | No statutory sinking fund |
| 3. Mega-Project Blowout Write-Down (PVS 4) Conservative $15.00B cost blowout written down at commissioning over N = 15 years |
Capitalized as “Asset” | $1.00B / yr | Shifted to housing levies |
| Target Net Operating Surplus (PVS 1) | $2.39B (Actual) | $8.86B (Required) | −$6.47B Surplus Shortfall |
| Intergenerational Equity Fund Transfer (PVS 2) Annual depreciation cash-quarantined under statutory Guardians & audited by VAGO |
$0.00B (Swept into cash pool) | $6.10B / yr | −$6.10B Unfunded Renewal Liability |
The Dual-Edged Verdict: Against the alarmists, Victoria is nowhere near “bankrupt”—it holds $289.1B in GGS physical assets and +$197.3B in Net Worth. Against Treasury complacency, however, a $2.39B operating surplus falls $6.47B short of the $8.86B required to fund a prudent 40% equity share of new infrastructure and retire pandemic and project-blowout consumption debt over 15 years—while $6.10B in annual depreciation cash is silently cannibalized rather than quarantined in an audited Intergenerational Equity Fund.
3.2 The 4-Year Forecast Stress Test (2026–27 to 2029–30): Exposing the $11.50B VicTrack Lease Loophole, the $10.46B COVID Levy Shell Game & the $32.79B Public Value Turnaround
Extending the Booth Tests across the four forward years of the 2026–27 Victorian State Budget — Statement of Finances (Budget Paper No. 5) uncovers three major structural distortions hidden beneath the Treasurer’s headline forecast of a +$6.82B cumulative General Government Sector (GGS) Operating Surplus (+$1,048M in 2026–27, +$1,864M in 2027–28, +$1,936M in 2028–29, and +$1,972M in 2029–30):
- The $11.50 Billion VicTrack Nominal-Lease Depreciation Loophole & Unfunded Rail Renewal (
Note 1.4.1, p. 43;Note 1.4.3, p. 46;Note 1.4.6, p. 47 &Table 2.6, p. 67): UnderNote 1.4.3(p. 46), as soon as the Department of Transport and Planning (GGS) completes major rail projects—such as the Underground Rail Loop / Metro Tunnel—it transfers the physical assets off the GGS Balance Sheet to VicTrack in the Public Non-Financial Corporations (PNFC) sector: transferring $26.35B in 2025–26 (the completed Metro Tunnel) plus $14.86B across 2026–30 ($41.20B total). Look at what this four-step mechanism actually does:- (a) Debt Stays in GGS While Equity Is Immediately Derecognized: The construction debt remains on the General Government Sector books (serviced by general taxpayers), while the asset is handed to VicTrack as an owner contribution (
Note 1.4.6(a)) and immediately derecognized via a −$25.59B economic loss in PNFC (Table 2.1(b), p. 61) and a −$17.45B revaluation loss in GGS (Note 1.4.6(b), p. 47) upon entering the nominal lease. - (b) Leased Back Free of Charge ($11.50B Depreciation Erased): DTP leases the commissioned rail assets back from VicTrack at nominal cost under
AASB 16not-for-profit relief (Note 1.4.1, p. 43). Because the asset sits at nominal value in both GGS and PNFC, $11,496M ($11.50B) of fair-value rail depreciation across 2026–30 ($2,691M,$2,793M,$2,903M,$3,109M) vanishes from the GGS Operating Statement—only reappearing in the consolidated Non-Financial Public Sector (NFPS,Table 2.6), where the GGS “surplus” flips into a −$8,909M 4-year NFPS Operating Deficit. - (c) Zero Capital Charge or IEF Contribution for Asset Renewal (
PVS 2Failure): Because there is no commercial lease charge, $0 of capital charge or Intergenerational Equity Fund (IEF) cash contribution flows back to the GGS to accumulate the $41.20B needed to renew those tunnels, tracks, and high-capacity trains when they wear out in X years. - (d) Commuter Fares Exclude Capital & Renewal Costs: Because neither GGS nor VicTrack charges capital servicing or
PVS 2renewal depreciation into public transport operations, metropolitan and regional fare pricing covers a fraction of operating cash costs and zero capital or renewal cost—meaning rail capital and renewal are 100% subsidized by general taxation and future debt rather than user charges, while nearby apartment builders are hit with property “value capture” taxes instead!
- (a) Debt Stays in GGS While Equity Is Immediately Derecognized: The construction debt remains on the General Government Sector books (serviced by general taxpayers), while the asset is handed to VicTrack as an owner contribution (
- The $10.46 Billion COVID Debt Levy Shell Game (
Note 1.2.1, p. 23): Between 2026–27 and 2029–30, the Budget collects $10,455M in dedicated COVID Debt Levies ($5,341MPayroll $10m+ surcharge and$5,114MLandholdings surcharge)—exceeding the $8,400M ($2.10B/yr) required under PVS 3 to amortize Victoria’s $31.5B pandemic debt over 15 years. Yet because those levies are swept into consolidated revenue without PVS 1 surplus discipline or a ring-fenced Sinking Fund, $0 of debt is retired and GGS Borrowings surge by +$40,324M (from$203.04Bto$243.37B). - The 1 January 2027 Activity Centre Housing Tax (
Note 1.2.1(c), p. 23): Rather than writing down mega-project cost blowouts at commissioning (PVS 4), Footnote(c)reveals a brand-new “Infrastructure Contributions” levy starting 1 January 2027 on property development across 10 pilot Train and Tram Zone (TTZ) Activity Centres, expanding to 48 additional TTZ Activity Centres on 1 July 2027—part of an $88.26B 4-year property and land tax burden that directly penalizes transit-oriented housing construction.
| Fiscal / Booth Test Component ($M) | 2026–27 Budget | 2027–28 Estimate | 2028–29 Estimate | 2029–30 Estimate | 4-Yr Total (2026–30) |
|---|---|---|---|---|---|
Gross GGS Infrastructure Purchases (Note 1.3.8) |
$14,952M | $14,368M | $14,955M | $15,738M | $60,013M |
Less: GGS Depreciation Renewal (PVS 2 Guardian IEF) |
($6,497M) | ($6,597M) | ($6,741M) | ($6,949M) | ($26,784M) |
| Net New GGS Capital Expansion | $8,455M | $7,771M | $8,214M | $8,789M | $33,229M |
1. Required 40% Equity Share (CapEx_Equity, PVS 1) |
$3,382M | $3,108M | $3,286M | $3,516M | $13,292M |
2. COVID-19 Consumption Debt Paydown ($31.5B / 15 yrs, PVS 3) |
$2,100M | $2,100M | $2,100M | $2,100M | $8,400M |
3. Commissioning Blowout Write-Down ($15.0B / 15 yrs, PVS 4) |
$1,000M | $1,000M | $1,000M | $1,000M | $4,000M |
| Booth Target GGS Operating Surplus (PVS 1) | +$6,482M | +$6,208M | +$6,386M | +$6,616M | +$25,692M |
Published GGS Operating Surplus (Ch. 1, p. 8) |
+$1,048M | +$1,864M | +$1,936M | +$1,972M | +$6,820M |
| GGS Surplus Shortfall (Face of GGS Accounts) | −$5,434M | −$4,344M | −$4,450M | −$4,644M | −$18,872M |
Hidden VicTrack Leased Rail Depreciation (Note 1.4.1) |
($2,691M) | ($2,793M) | ($2,903M) | ($3,109M) | ($11,496M) |
| True GGS Operating Balance (After Rail Depreciation) | −$1,643M | −$929M | −$967M | −$1,137M | −$4,676M |
Consolidated NFPS Operating Balance (Table 2.6, p. 67) |
−$2,856M | −$1,760M | −$1,985M | −$2,308M | −$8,909M |
How the 4-Year Balance Sheet Looks Under Public Value Laws (PVS 1–4 Enforced)
By reigning in unallocated recurrent output contingencies (Note 1.3.7, p. 39, which balloon from $5,236M in 2026–27 to $12,824M in 2029–30), quarantining 100% of annual depreciation cash ($26,784M) in the Guardian-governed Intergenerational Equity Fund (PVS 2) to fund renewal debt-free, paying down $3,100M/yr of COVID and Blowout Consumption Debt (PVS 3 & PVS 4), and repealing the Windfall Gains Tax and new 2027 TTZ Activity Centre housing levies (−$774M tax relief), Victoria delivers the exact same $60.01B GGS infrastructure program while cutting 2030 Borrowings by −$32.79B and driving Net Debt down to 21.18% of GSP:
| Balance Sheet / Fiscal Metric ($M) | 2026–27 Budget | 2027–28 Estimate | 2028–29 Estimate | 2029–30 Estimate | 4-Yr Public Value Impact |
|---|---|---|---|---|---|
Public Value Operating Surplus (PVS 1 Compliant) |
+$6,482M | +$6,208M | +$6,386M | +$6,616M | +$25,692M (+$18.87B vs. Pub) |
Guardian IEF Renewal Cash Quarantined (PVS 2) |
$6,497M | $6,597M | $6,741M | $6,949M | $26,784M Renewal Funded |
Unfunded Intergenerational Renewal Liability (PVS 2) |
$0M (Pub: $6,497M) | $0M (Pub: $13,094M) | $0M (Pub: $19,835M) | $0M (Pub: $26,784M) | −$26,784M Liability Avoided |
Productive Asset-Backed Capital Debt (PVS 3, 60% Net New) |
$161,617M | $166,280M | $171,208M | $176,481M | +$19,937M Asset-Backed |
Unbacked Consumption & Blowout Debt (PVS 3 & 4 Sinking Fund) |
$43,400M | $40,300M | $37,200M | $34,100M | −$12,400M Debt Extinguished |
| Total GGS Borrowings Under Public Value Laws | $205,017M | $206,580M | $208,408M | $210,581M | −$32,787M Lower Borrowings! |
Compare: Published Budget GGS Borrowings (Note 1.5.1) |
$214,442M | $223,387M | $233,189M | $243,368M | +$40,324M Borrowing Surge |
| Public Value GGS Net Debt (% of GSP) | $167.3B (23.8%) | $168.9B (22.9%) | $170.7B (22.0%) | $172.9B (21.2%) | Drops to 21.18% of GSP! |
| Compare: Published Budget GGS Net Debt (% of GSP) | $175.6B (24.9%) | $183.2B (24.8%) | $191.1B (24.6%) | $199.3B (24.4%) | Stagnant at 24.4%–24.9% GSP |
| Public Value GGS Net Worth (Equity) | +$173,404M | +$186,068M | +$206,523M | +$220,030M | +$58,778M True Equity Gain |
4. Proposed Public Sector Accounting & Fiscal Reporting Standards (PVS 1–4)
Why have Treasury economists been able to ignore Whole-of-Government Financial Statements for thirty years? Because existing public sector standards—specifically AASB 1049 (Whole of Government and General Government Sector Financial Reporting), AASB 116 (Property, Plant and Equipment), and AASB 136 (Impairment of Assets)—permit passive accrual reporting without enforcing balance-sheet discipline.
To reform public finance across Australia and comparable sovereign jurisdictions, the Australian Accounting Standards Board (AASB), the International Public Sector Accounting Standards Board (IPSASB), Auditors-General, and Parliamentary Public Accounts and Estimates Committees (PAEC) should adopt four binding standards:
| Standard | Standard Title | Target AASB / Statutory Instrument | Mandatory Reporting & Governance Requirement |
|---|---|---|---|
| PVS 1 | Operating Surplus Objective Function Disclosure | AASB 1049 & Annual Budget Papers |
Prohibits reporting an unanchored “Net Operating Balance.” Every Budget and Financial Report must publish a statutory Surplus Objective Reconciliation decomposing the Operating Surplus into: (a) required equity contribution to net new capital expenditure (CapEx_Equity), and (b) scheduled annual amortization of unbacked consumption debt. |
| PVS 2 | The Intergenerational Equity Fund & Annual Auditor-General Sign-Off | AASB 116 & AASB 1049 Operating Statement & Balance Sheet |
Replaces toothless 5-year, 500-page “Intergenerational Reports” with an annual audited charge. Requires annual GGS depreciation expense to be matched by a dedicated cash transfer into a statutory Intergenerational Equity Fund governed by Guardians appointed by Government. Any shortfall must be booked on the Balance Sheet as an Unfunded Intergenerational Equity Liability and audited every year by the Auditor-General to guarantee zero creative accounting. |
| PVS 3 | Sovereign Debt Bifurcation & N-Year Sinking Fund Standard | AASB 1049 Balance Sheet & Notes |
Prohibits commingling all borrowings into a single “Net Debt” line. Mandates separate Balance Sheet presentation of (1) Productive Capital Debt (asset-backed) and (2) Unbacked Consumption Debt (recurrent deficits, crisis relief, and impaired capital blowouts), accompanied by a binding parliamentary N-year sinking-fund schedule (N ≤ 15 years). |
| PVS 4 | Commissioning Economic Impairment & Value-Capture Neutrality | AASB 13 (Fair Value) & AASB 136 (Impairment) |
Abolishes the “Depreciated Replacement Cost” shelter for mega-project blowouts. Upon commissioning, the Auditor-General must certify an independent Economic & Social Utility Valuation. Any expenditure exceeding true economic value must be written down immediately and transferred into Unbacked Consumption Debt (PVS 3)—preventing recovery via housing-destroying value capture levies. |
Continue the Conversation on The Observer’s Log
Read the serialized Public Value dispatches on Substack or explore Ralph Booth’s hard science fiction series, The Odyssey Chronicles.